Plot a plan position indicator (PPI) generated with project_to_ppi
using ggplot
Arguments
- x
An object of class
ppi.- param
The scan parameter to plot, see details below.
- xlim
Range of x values to plot.
- ylim
Range of y values to plot.
- zlim
The range of parameter values to plot. Defaults to parameter specific limits for plotting, not full range of data.
- ratio
Aspect ratio between x and y scale.
- na.value
ggplot argument setting the plot color of NA values
- ...
Arguments passed to low level ggplot function.
Details
Available scan parameters for plotting can by printed to screen
by summary(x). Commonly available parameters are:
DBZH,DBZ: (Logged) reflectivity factor (dBZ)TH,T: (Logged) uncorrected reflectivity factor (dBZ)VRADH,VRAD: Radial velocity (m/s). Radial velocities towards the radar are negative, while radial velocities away from the radar are positiveRHOHV: Correlation coefficient (unitless). Correlation between vertically polarized and horizontally polarized reflectivity factorPHIDP: Differential phase (degrees)ZDR: (Logged) differential reflectivity (dB) The scan parameters are named according to the OPERA data information model (ODIM), see Table 16 in the ODIM specification.
Examples
# \donttest{
# load an example scan:
data(example_scan)
# print to screen the available scan parameters:
summary(example_scan)
#> Polar scan (class scan)
#>
#> parameters: DBZH VRADH RHOHV ZDR PHIDP
#> elevation angle: 0.5 deg
#> dims: 480 bins x 360 rays
# make ppi for the scan
ppi <- project_as_ppi(example_scan)
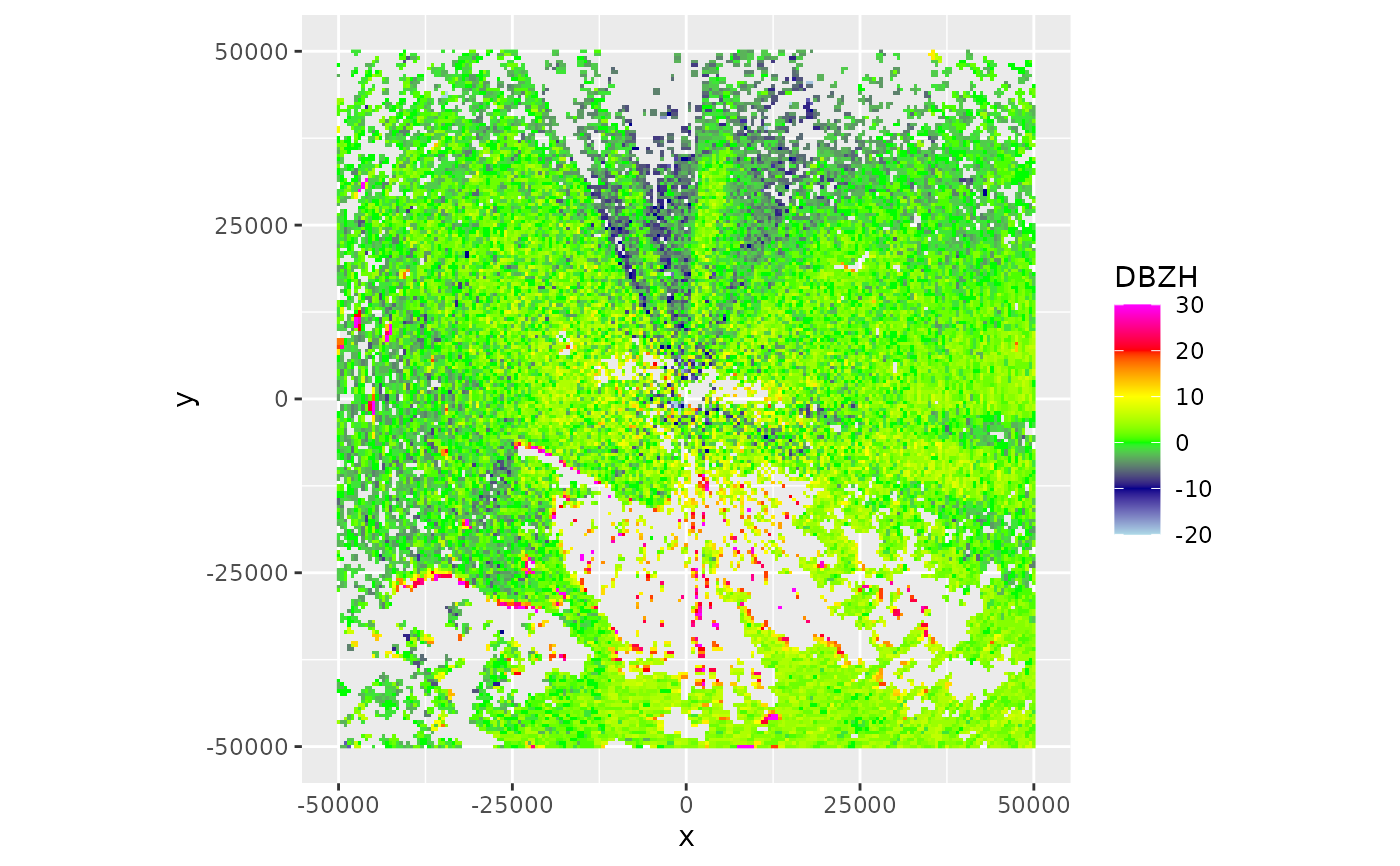
# plot the default scan parameter, which is reflectivity "DBZH":
plot(ppi)
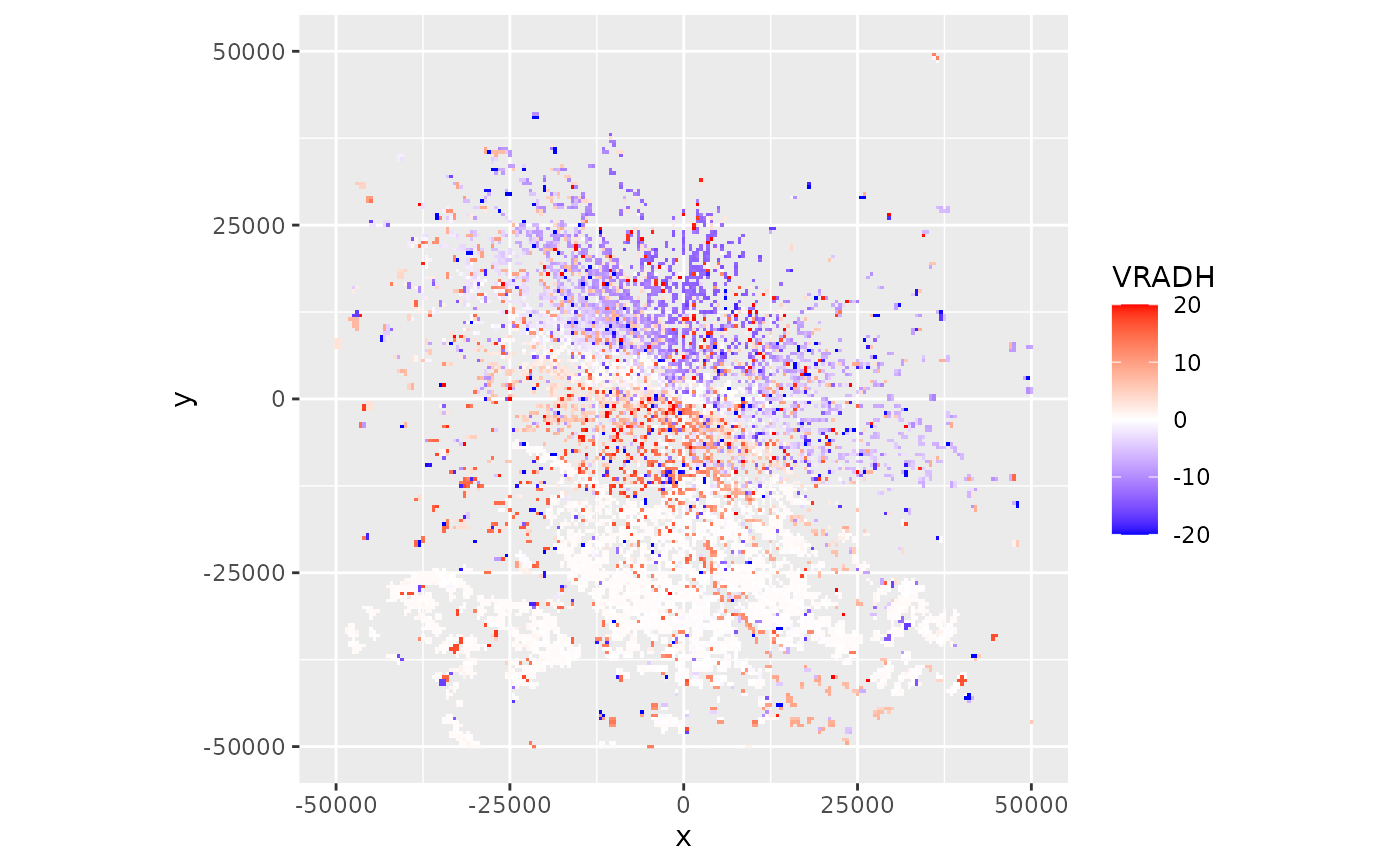
 # plot the radial velocity parameter:
plot(ppi, param = "VRADH")
# plot the radial velocity parameter:
plot(ppi, param = "VRADH")
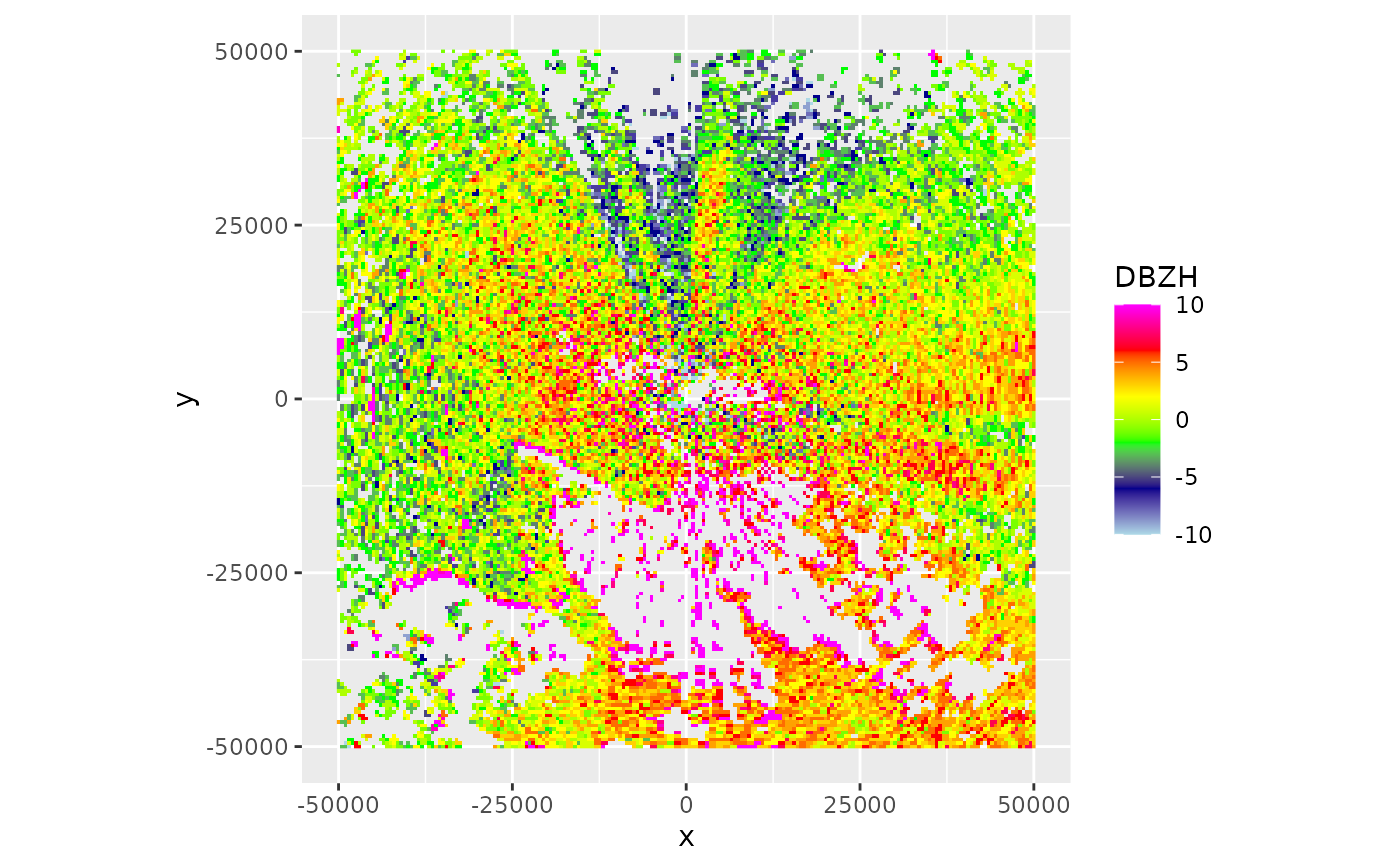
 # change the range of reflectivities to plot, from -10 to 10 dBZ:
plot(ppi, param = "DBZH", zlim = c(-10, 10))
# change the range of reflectivities to plot, from -10 to 10 dBZ:
plot(ppi, param = "DBZH", zlim = c(-10, 10))
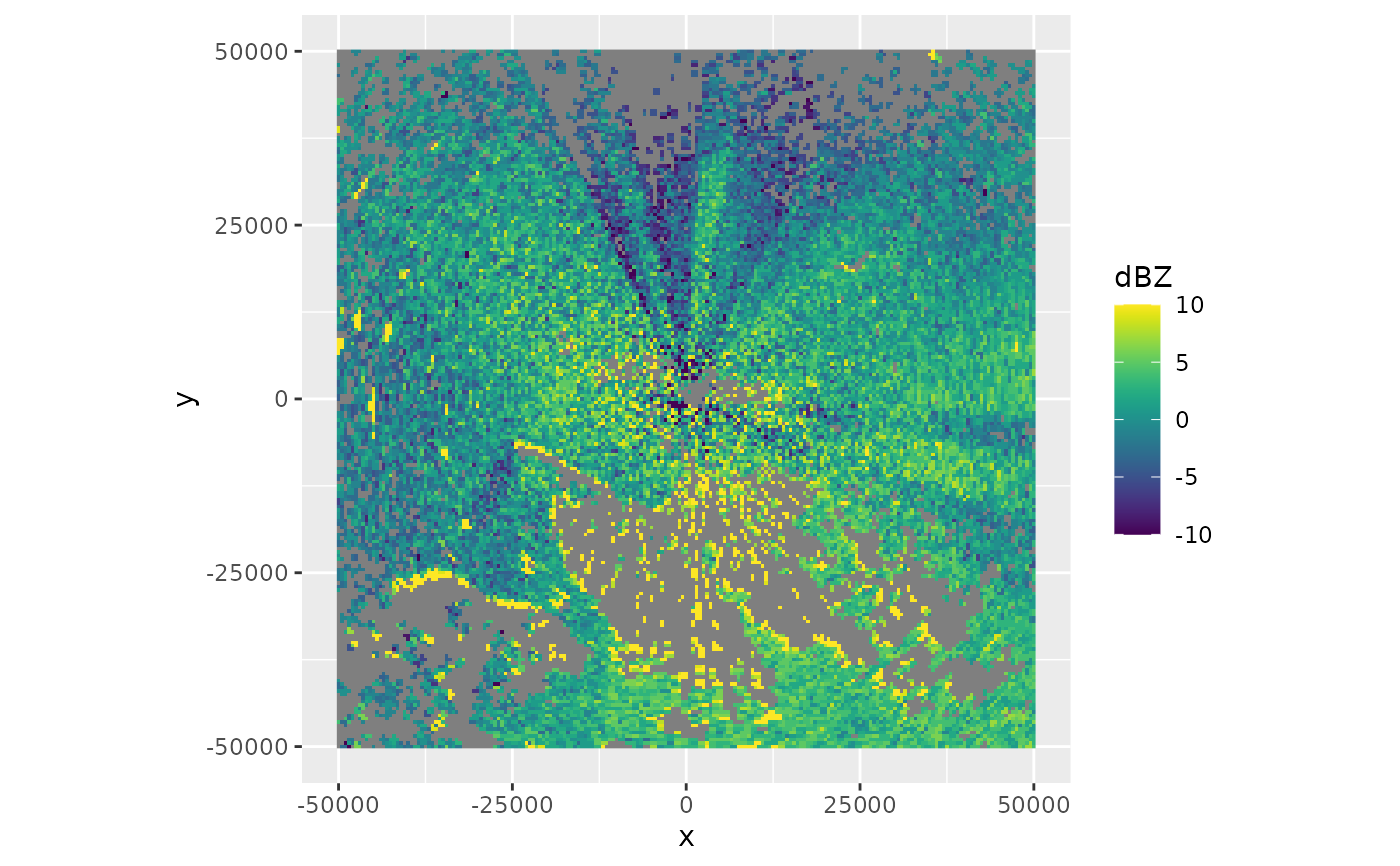
 # change the scale name and colour scheme, using viridis colors:
plot(ppi, param = "DBZH", zlim = c(-10, 10)) + viridis::scale_fill_viridis(name = "dBZ")
#> Scale for fill is already present.
#> Adding another scale for fill, which will replace the existing scale.
# change the scale name and colour scheme, using viridis colors:
plot(ppi, param = "DBZH", zlim = c(-10, 10)) + viridis::scale_fill_viridis(name = "dBZ")
#> Scale for fill is already present.
#> Adding another scale for fill, which will replace the existing scale.
 # }
# }