Plots a plan position indicator (ppi) on a base layer
Usage
map(x, ...)

# S3 method for class 'ppi'
map(
  x,
  map = "cartolight",
  param,
  alpha = 0.7,
  xlim,
  ylim,
  zlim = c(-20, 20),
  ratio,
  radar_size = 3,
  radar_color = "#202020",
  n_color = 1000,
  palette = NA,
  zoomin = -2,
  cachedir = tools::R_user_dir("bioRad"),
  ...
)
Arguments
- x
A
ppiobject.- ...
Arguments passed to
ggplot2::ggplot().- map
Basemap to use, one of
rosm::osm.types()- param
Character. Scan parameter to plot, e.g.
DBZHorVRADH. Seesummary.param()for commonly available parameters.- alpha
Numeric. Transparency of the data, value between 0 and 1.
- xlim
Numeric vector of length 2. Range of x values (degrees longitude) to plot.
- ylim
Numeric vector of length 2. Range of y values (degrees latitude) to plot.
- zlim
Numeric vector of length 2. The range of values to plot.
- ratio
Numeric. Aspect ratio between x and y scale, by default \(1/cos(latitude radar * pi/180)\).
- radar_size
Numeric. Size of the symbol indicating the radar position. Use
NULLif you do not want to plot the radar point. This might be useful the radar is outside the range of data.- radar_color
Character. Color of the symbol indicating the radar position.
- n_color
Numeric. Number of colors (>=1) to use in the palette.
- palette
Character vector. Hexadecimal color values defining the plot color scale, e.g. output from
viridisLite::viridis().- zoomin
Numeric. Maps to
ggspatial::annotation_map_tile()- cachedir
Character. Maps to
ggspatial::annotation_map_tile(), defaults totools::R_user_dir("bioRad")
Details
Available scan parameters for mapping can by printed to screen by
summary(x). Commonly available parameters are:
DBZH,DBZ: (Logged) reflectivity factor (dBZ)TH,T: (Logged) uncorrected reflectivity factor (dBZ)VRADH,VRAD: Radial velocity (m/s). Radial velocities towards the radar are negative, while radial velocities away from the radar are positiveRHOHV: Correlation coefficient (unitless) Correlation between vertically polarized and horizontally polarized reflectivity factorPHIDP: Differential phase (degrees)ZDR: (Logged) differential reflectivity (dB) The scan parameters are named according to the OPERA data information model (ODIM), see Table 16 in the ODIM specification.
See also
Other ppi functions:
[.ppi(),
plot.ppi(),
summary.ppi()
Examples
# Project a scan as a ppi
ppi <- project_as_ppi(example_scan)
# \donttest{
if (all(sapply(c("ggspatial","prettymapr", "rosm"), requireNamespace, quietly = TRUE))) {
# Choose a basemap
basemap <- rosm::osm.types()[1]
# Map the radial velocity of the ppi onto the basemap
map(ppi, map = basemap, param = "VRADH")
# Extend the plotting range of velocities, from -50 to 50 m/s
map(ppi, map = basemap, param = "VRADH", zlim = c(-50, 50))
# Map the reflectivity
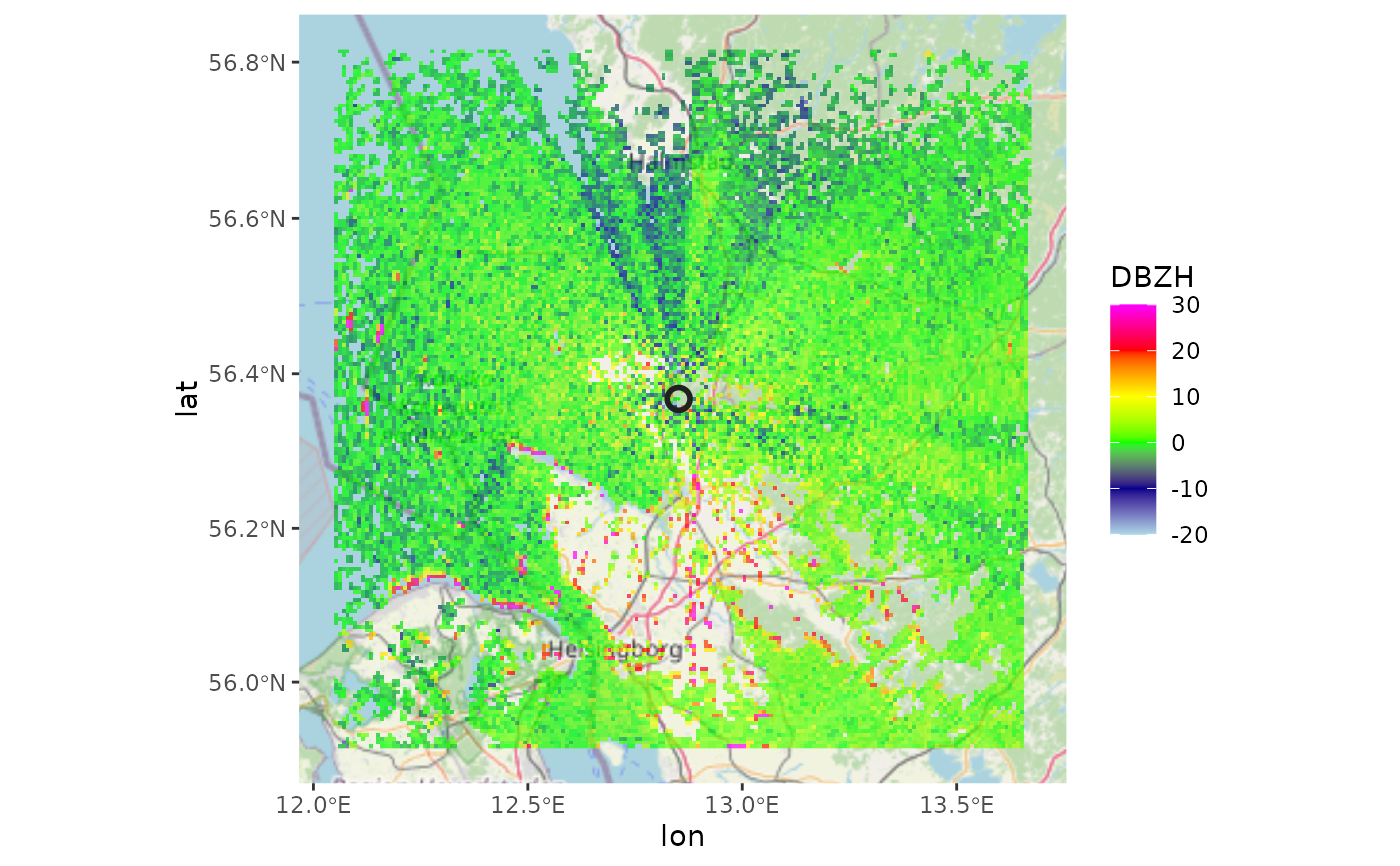
map(ppi, map = basemap, param = "DBZH")
# Change the color palette to Viridis colors
map(ppi, map = basemap, param = "DBZH", palette = viridis::viridis(100), zlim=c(-10,10))
# Give the data more transparency
map(ppi, map = basemap, param = "DBZH", alpha = 0.3)
# Change the appearance of the symbol indicating the radar location
map(ppi, map = basemap, radar_size = 5, radar_color = "blue")
# Crop the map
map(ppi, map = basemap, xlim = c(12.4, 13.2), ylim = c(56, 56.5))
}
#> Zoom: 9
#> Fetching 4 missing tiles
#>
|
| | 0%
|
|================== | 25%
|
|=================================== | 50%
|
|==================================================== | 75%
|
|======================================================================| 100%
#> ...complete!
 # }
# }