Plots a plan position indicator (ppi) on a base layer
Usage
map(x, ...)

# S3 method for class 'ppi'
map(
  x,
  map = "cartolight",
  param,
  alpha = 0.7,
  xlim,
  ylim,
  zlim = c(-20, 20),
  ratio,
  radar_size = 3,
  radar_color = "#202020",
  n_color = 1000,
  palette = NA,
  zoomin = -2,
  cachedir = tools::R_user_dir("bioRad"),
  ...
)
Arguments
- x
A
ppiobject.- ...
Arguments passed to
ggplot2::ggplot().- map
Basemap to use, one of
rosm::osm.types()- param
Character. Scan parameter to plot, e.g.
DBZHorVRADH. Seesummary.param()for commonly available parameters.- alpha
Numeric. Transparency of the data, value between 0 and 1.
- xlim
Numeric vector of length 2. Range of x values (degrees longitude) to plot.
- ylim
Numeric vector of length 2. Range of y values (degrees latitude) to plot.
- zlim
Numeric vector of length 2. The range of values to plot.
- ratio
Numeric. Aspect ratio between x and y scale, by default \(1/cos(latitude radar * pi/180)\).
- radar_size
Numeric. Size of the symbol indicating the radar position.
- radar_color
Character. Color of the symbol indicating the radar position.
- n_color
Numeric. Number of colors (>=1) to use in the palette.
- palette
Character vector. Hexadecimal color values defining the plot color scale, e.g. output from
viridisLite::viridis().- zoomin
Numeric. Maps to
ggspatial::annotation_map_tile()- cachedir
Character. Maps to
ggspatial::annotation_map_tile(), defaults totools::R_user_dir("bioRad")
Details
Available scan parameters for mapping can by printed to screen by
summary(x). Commonly available parameters are:
DBZH,DBZ: (Logged) reflectivity factor (dBZ)TH,T: (Logged) uncorrected reflectivity factor (dBZ)VRADH,VRAD: Radial velocity (m/s). Radial velocities towards the radar are negative, while radial velocities away from the radar are positiveRHOHV: Correlation coefficient (unitless) Correlation between vertically polarized and horizontally polarized reflectivity factorPHIDP: Differential phase (degrees)ZDR: (Logged) differential reflectivity (dB) The scan parameters are named according to the OPERA data information model (ODIM), see Table 16 in the ODIM specification.
Examples
# Project a scan as a ppi
ppi <- project_as_ppi(example_scan)
# \donttest{
if (all(sapply(c("ggspatial","prettymapr", "rosm"), requireNamespace, quietly = TRUE))) {
# Choose a basemap
basemap <- rosm::osm.types()[1]
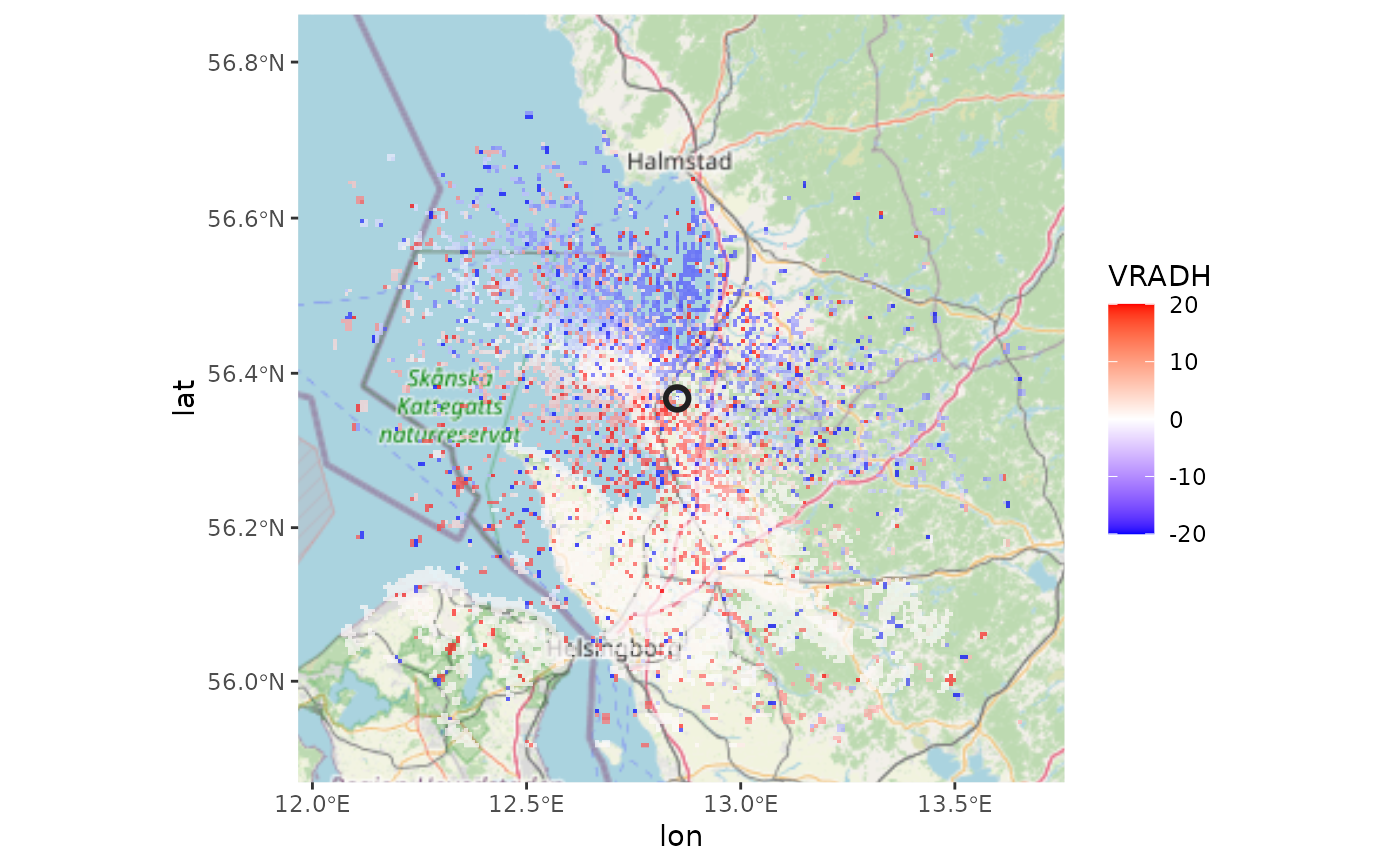
# Map the radial velocity of the ppi onto the basemap
map(ppi, map = basemap, param = "VRADH")
# Extend the plotting range of velocities, from -50 to 50 m/s
map(ppi, map = basemap, param = "VRADH", zlim = c(-50, 50))
# Map the reflectivity
map(ppi, map = basemap, param = "DBZH")
# Change the color palette to Viridis colors
map(ppi, map = basemap, param = "DBZH", palette = viridis::viridis(100), zlim=c(-10,10))
# Give the data more transparency
map(ppi, map = basemap, param = "DBZH", alpha = 0.3)
# Change the appearance of the symbol indicating the radar location
map(ppi, map = basemap, radar_size = 5, radar_color = "blue")
# Crop the map
map(ppi, map = basemap, xlim = c(12.4, 13.2), ylim = c(56, 56.5))
}
#> Zoom: 9
#> Fetching 4 missing tiles
#>
|
| | 0%
|
|================== | 25%
|
|=================================== | 50%
|
|==================================================== | 75%
|
|======================================================================| 100%
#> ...complete!
 # }
# }